|
|||||||||
|
|
This website was created as a project for Genetics 677 at the University of Wisconsin-Madison in the spring of 2009 Microarray expression data
Microarray experiments examine the global expression pattern of genes, which is particularly useful in analyzing shifts in expression following different cellular treatments or perturbation. The following experiments examined the effect of a mutant huntingtin gene on expression patterns in Mus musculus in comparison to treatments designed to mimic the expected effects of the gene. The researchers treated wild type mice with a drug of known action and effect, then used microarray data to determine whether the global gene expression pattern after treatment resembled the pattern of mutant huntingtin. This gives information as to the full genetic mechanism of the disease. Experiment 1: Huntingtin mutant expression profile does not match 3-NP induced mitochondrial disruption
Lee et al. conducted a microarray analysis of expression patterns in 3-nitropropionic acid (3-NP) treated mice, which is a known mitochondrial inhibitor in striatal cells (1). The researchers used an Affymetrix chip containing the entire mouse genome, labled as platform GPL1261 or the Affymetrix mouse genome array 430 2.0. Mutant huntingtin affects neuronal metabolism, which led Lee to hypothesize the changes in gene expression patterns from 3-NP treated mice should show some similarity to mutant huntingtin expression patterns. 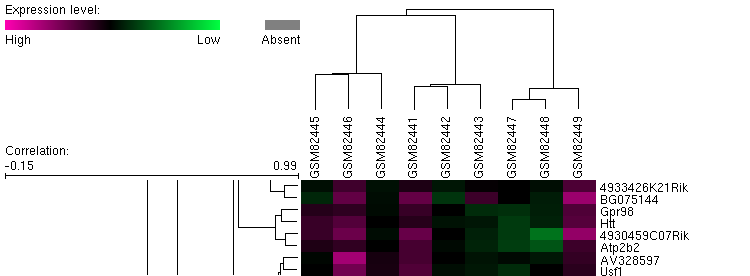 Figure 1, above: The figure represents a microarray cluster anaylsis of gene expression. Located in the fourth row of the cluster map is Htt, as noted by the gene names listed on the far right. The rightmost three columns represent a sample with a mutant form of huntingtin, and expression is slightly repressed, which is most clearly seen in green samples GSM82447 and GSM82448. In general, the other samples are neither strongly induced or repressed. 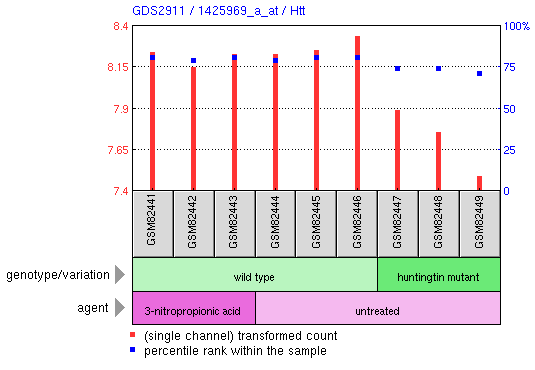 Figure 2, left: This figure demonstrates the relative expression of the actual Htt huntingtin gene in the experiment. We see in the huntingtin mutant that levels of huntingtin are slightly reduced from wild type levels. In contrast, treatment with 3-NP does not repress expression of Htt. Although the study focused primarily on the global expression changes in mice with mutant huntingtin and treatment with 3-NP, we can see from this graph that expression of Htt in mutants for that gene does not correlate with treatment by 3-NP. Thus, mitochondrial disruption is not a valid description of the effects of mutant huntingtin. The example below provides stronger evidence for this observation.  Figure 3, above: The graph above depicts expression of one gene, Tubb2b, a which encodes for tubulin, in striatal cells. In the wild-type cell (center 3 columns) we see a relatively high level of expression of the gene. In huntingtin mutant cells, expression is quite low for Tubb2b. In contrast, when wildtype cells are treated with the mitochondrial disrupting chemical 3-NP, expression is unchanged from the wild type pattern. This is a single example of differential expression between 3-NP treated cells and huntingtin mutants; the researchers analyzed the entire mouse genome to determine the expression patterns for the two treatments were not similar. Experiment 2: Decreased transcirption in mutant huntingtin mouse model R6/1 correlates with changes in behavior associated with Huntington's disease.
Hodges et al. used a mouse engineered to overexpress the exon 1 mutation in huntingting associated with the disease and analyzed microarray data over time to correlate decreased transcriptional activity with the onset of behavioral changes common to the disease (2). Utilizing the R6/1 mouse model compared to wild type mice, the researchers noted the decrease in transcription in neuronal cells does correlate strongly with the onset of behavioral modifications. The researchers noted the most heavily downregulated genes in the R6/1 model were associated with electrical and intracellular signaling. Certain genes were noted to be overexpressed as well, especially those involved in lipid biosynthesis and RNA processes. The authors concluded that certain subsets of genes are responsible for a specific behavioral function. This indicated the necessity for therapeutic trails for the disease to account for the behavioral "domains" which are dysfunctional in the disease. The platform used by the researchers was the Affymetrix mouse genome array 430 2.0 (GPL1261) Figure 4, right: Depiction of the Cnr1 gene expression changes over time in the R6/1 transgenic mouse and a wild type mouse. Cnr1 is a cannabinoid receptor involved in neuronal signalling. 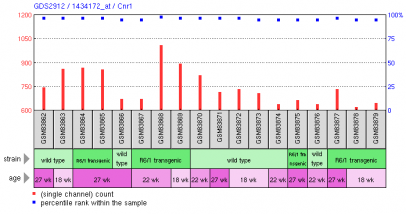 Experiment 3: Microarray analysis of human brain tissue of individuals affected by Huntington's disease demonstrates gene expression changes in different regions of the brainHodges et al. also conducted a full microarray analysis on the brains of Huntington's disease patients (3). This study was the first to utilize microarray anaylsis on human Huntington's disease patients. The primary evidence obtained by Hodges shows the alteration in gene expression is most altered in the caudate nucleus. The motor cortex and cerebellum also showed altered gene expression. No gene expression changes were noticed in the prefrontal association cortex. The importance of the study is demonstrating the changes in gene expression, as previously noted in in vitro studies, do no result from the loss of cells, but rather occur early in the onset of disease. Thus, the researchers confirmed the alterations in gene expression contribute to neuropathology of the disease, rather than result from it. Created by Eric Nickels [email protected] 4/16/2009 Genetics 677 Webpage References: |
||||||||
|
|
|||||||||
